
Branches find their lanes
Follow a line through splits and merges. Active branches get lanes, and lanes can be reused when a branch ends.
AN SVG RENDERER FOR REACT
Turn commit relationships into a graph you can read at a glance. Repository Graph lays out branches, follows merges, and lets your interface decide how every node and edge looks.
Open source · React 18+ · SVG output
Drawing commit history…
Commits are easy to list. Branches and merges are harder to understand in a plain table.
Repository Graph takes commit IDs and parent IDs, assigns lanes, and draws the connecting paths as SVG. It stays focused on the graph so you can place it inside a repository browser, a build dashboard, or whatever story your product needs to tell.
See the data contractA LITTLE HISTORY, IN MOTION
Switch histories, palettes, and marks. The graph below is rendered by the actual GitGraph component, with sample commits created for this demo.
The renderer makes the geometry predictable while leaving the visual language open. A few props can change spacing, colors, nodes, and edges without rewriting graph layout.
Follow a line through splits and merges. Active branches get lanes, and lanes can be reused when a branch ends.
Supply a color palette or custom callbacks for nodes, edges, and curves. The output remains ordinary SVG.
Add commit messages, badges, selection, or tooltips beside the graph. The package does not impose a full repository UI.
FROM THE SOURCE REPOSITORY
The project examples show the same lane and path logic rendered with different node and edge treatments. Custom drawing stays in React callbacks, close to the rest of your interface.
See a custom renderer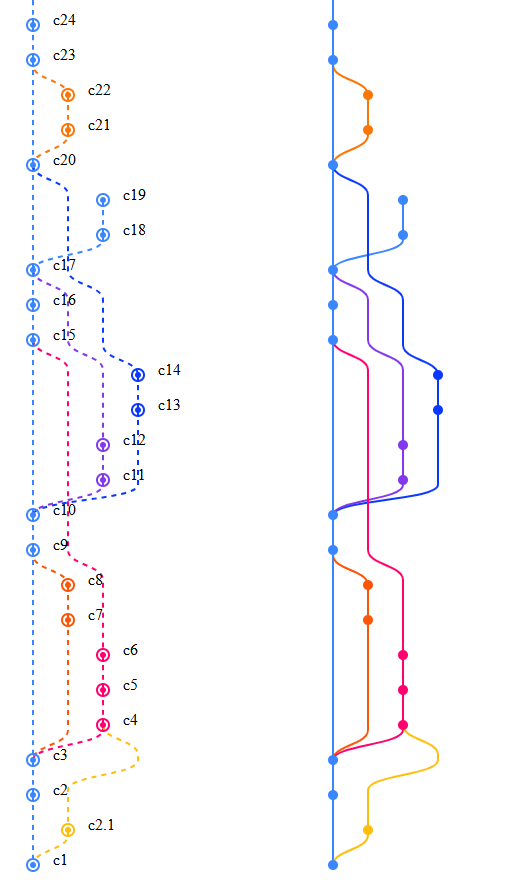
Install the package, pass a commit array, and let GitGraph draw the history. The API page has the full short reference and a custom node example.
# Add it to a React project
$ npm install git-graph-svg

# Render your commit history
<GitGraph commits={commits} />